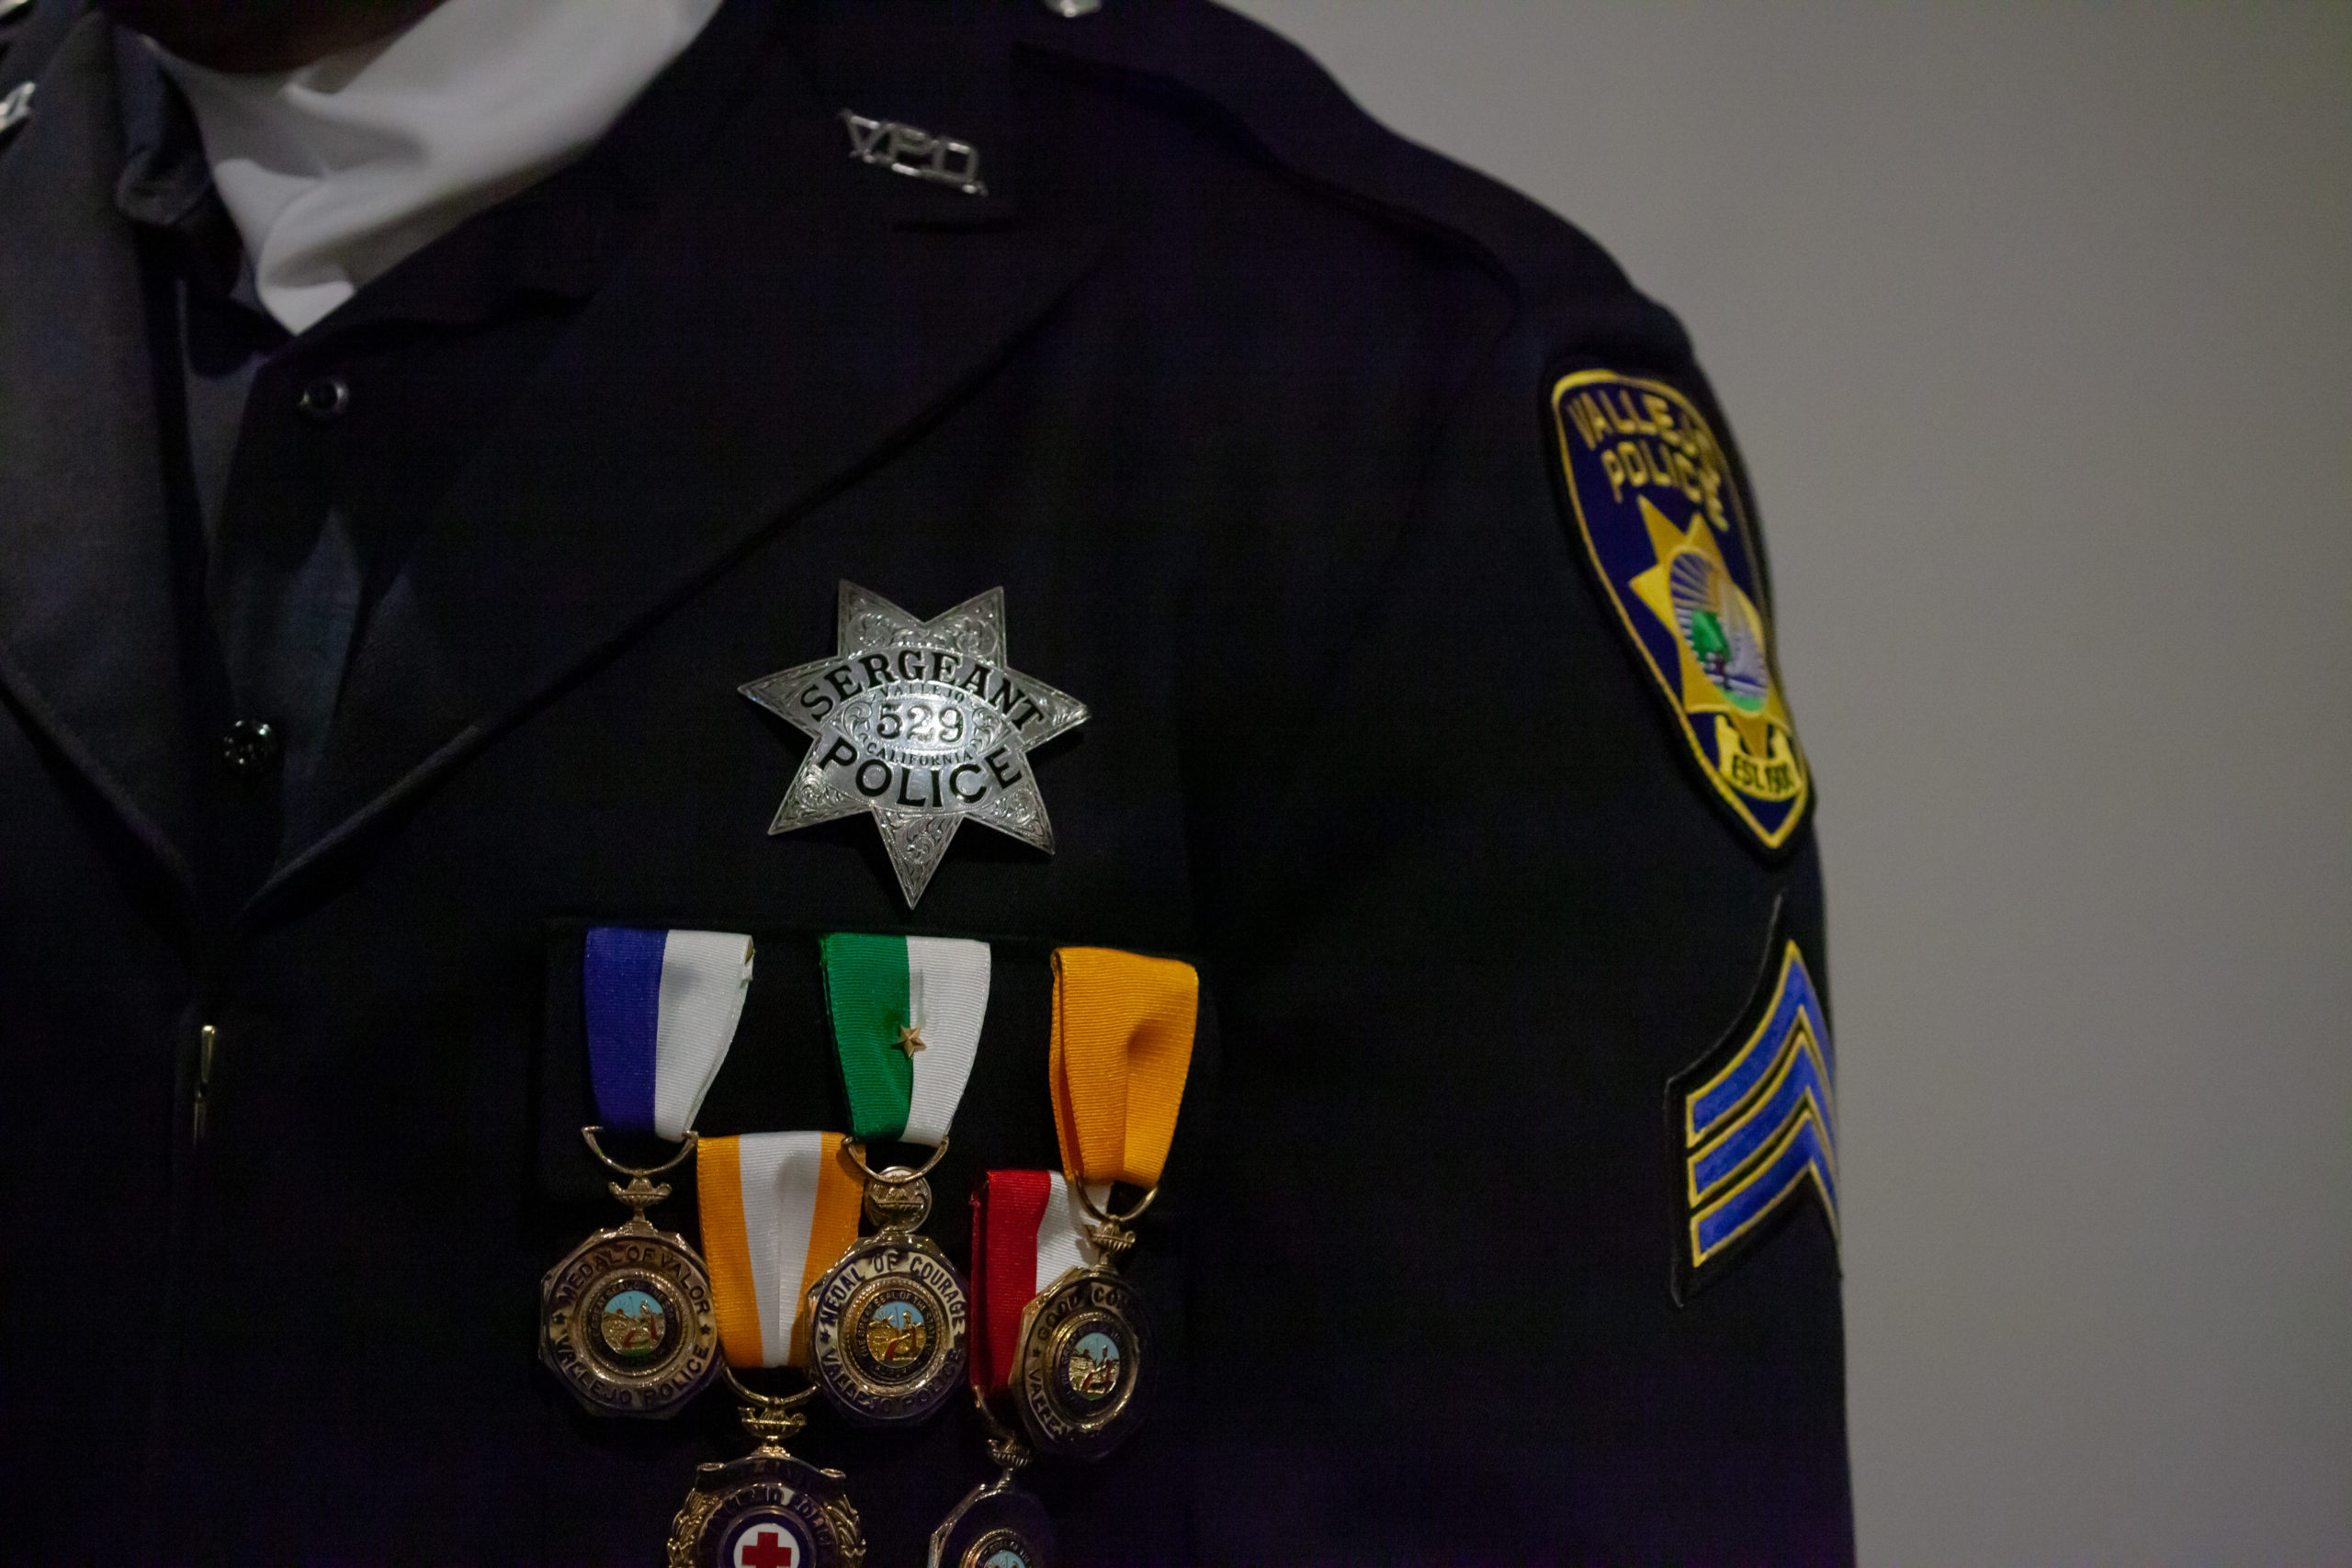
An Open Vallejo investigation found that members of the Vallejo Police Department bent the corners of their badges each time they killed someone while on duty
Open Vallejo
by Geoffrey King
It started with a disturbing tip: Police officers in Vallejo, California, were bending the points of their badges to mark each on-duty killing.
There had long been rumors of a gang-like culture within the Vallejo Police Department, which is one of the deadliest law enforcement agencies in the country, data show. And by 2018, the roughly 100-member department had cost Vallejo so much in civil rights settlements that the city was forced from its municipal insurance pool of more than three decades.
The source was credible, the allegation plausible. But Open Vallejo was still a one-person operation, an experimental newsroom without so much as a public-facing website. Moreover, while I had previously written articles on topics within the scope of my work as a First Amendment lawyer and press freedom advocate, I had little experience with producing and publishing an original work of investigative reporting.
But I did know that the facts had to speak for themselves.
Open Vallejo’s first major investigation, which took nine months to produce, was conducted almost entirely using open-source techniques. I started by examining every photograph of a Vallejo police badge I could find. This included countless hours spent reviewing, collecting, and analyzing materials from the city’s website, the department’s official social media accounts, and officers’ often-pseudonymous personal Facebook profiles. I soon found that the curved, polished metal lends itself to glints, reflections, and other visual artifacts. Combined with the low resolution of many of the photographs, and the city’s refusal to disclose photographs in the possession of the department, I set out to make some examples of my own.
In 2019, Vallejo hired its first Black police chief in the police department’s then-119-year history, Shawny Williams. Community members and police officers packed the city council chambers for his historic swearing-in ceremony. Although most Vallejo officers wear utility uniforms bearing an embroidered patch while on patrol, the occasion meant that many of those present were in more formal uniforms, and thus wearing a metal badge. While covering the event I photographed as many badges up close as I could.
Related Posts
Not only did one of those photographs become the story’s main image, but when I compared the detailed pictures to others I had gathered, they revealed that the first bend is often applied at the 4 o’clock tip of an officer’s seven-point star.
By now I had developed a number of sources with knowledge of the badge-bending tradition. To understand the scope of the tradition, I also used public records to build a database of shootings and other fatalities involving Vallejo police, which Open Vallejo released under a Creative Commons license days after the story went live; it remains the most comprehensive account of the department’s critical incidents available from any source. Eventually, the photographs, sourcing, and other evidence lined up. As our publication date neared, I received several credible, frightening, anonymous threats.
Open Vallejo launched its website on July 28, 2020, with the badge-bending investigation as our top story. The city manager initially denied the report, then quickly backtracked. The mayor, a former police sergeant, confirmed it. A former Vallejo police chief called it “a figment of someone’s imagination.” Days later, Williams, the new police chief, announced a third-party investigation.
The story is now impacting cases in both state and federal courts. Civil rights lawyers point to badge-bending to argue the police department should be placed under federal oversight, while criminal defense attorneys have used it to impeach the statements of alleged participants in the tradition. The California Department of Justice, which launched a review of the department in June of 2020 due to the “number and nature” of killings by Vallejo police, is now facing renewed pressure to impose reforms following Williams’ recent resignation.
Open Vallejo’s critical incident database shows that over the past 20 years, Vallejo police have engaged in a shooting once every four months, on average; 30 people have died. Most recently, a Vallejo police detective shot 22-year-old Sean Monterrosa in the back of the head, killing him. Monterrosa, who possessed only a hammer, which the detective mistook for a gun, died while participating in the uprising over George Floyd’s murder.
For a small-but-scrappy newsroom like ours, open-source techniques are vital. Consumer-grade technology has made it possible to collect, organize, and analyze large amounts of information. This allows us to shed new light on longstanding injustices and uncover what is hiding in plain sight.
More than two and a half years after Monterrosa’s tragic and unnecessary death, Vallejo police have yet to shoot at another human being. Whether our work has contributed to the peace, or to what degree, is unknowable. But the mere possibility means our work must — and will — continue.
The Washington Post
by Nadine Ajaka and Elyse Samuels
When Travis Scott’s Astroworld performance ended in Houston on Nov. 5, 2021, it was clear there had been a disaster: 10 people in the crowd died and dozens more were injured. The toll made it one of the deadliest concerts in the nation’s history.
Reporters from The Washington Post set out to answer how this could have happened by harnessing the power of open-sourced video — after all, many young fans were filming the high-energy performance, an event that marked the return of pre-pandemic concerts. The result was a compelling and troubling video investigation that revealed that the dead were packed into one overcrowded quadrant where they were crushed to death.
Using overhead imagery of the crowd, we worked with researchers at Carnegie Mellon University to calculate the crowd density. Parts of the area where many of the dead were concentrated had as little as 1.85 square feet per person. A density of 1.5 square feet per person can cause compressive asphyxiation, leaving so little space that people cannot draw breath, according to the crowd experts. Weeks after our story, the medical examiner released causes of death from the concert: compression asphyxia for all 10.
To arrive at these findings, Shawn Boburg, Sarah Cahlan, Joyce Sohyun Lee, Atthar Mirza, and Elyse Samuels examined more than 100 videos — some exclusively obtained from witnesses but most found online. The team geolocated the footage and synchronized the clips using video and audio cues. The investigation included 3D-modeling of the stage and venue drawn from festival plans in public filings, satellite imagery, and our own drone flyovers.
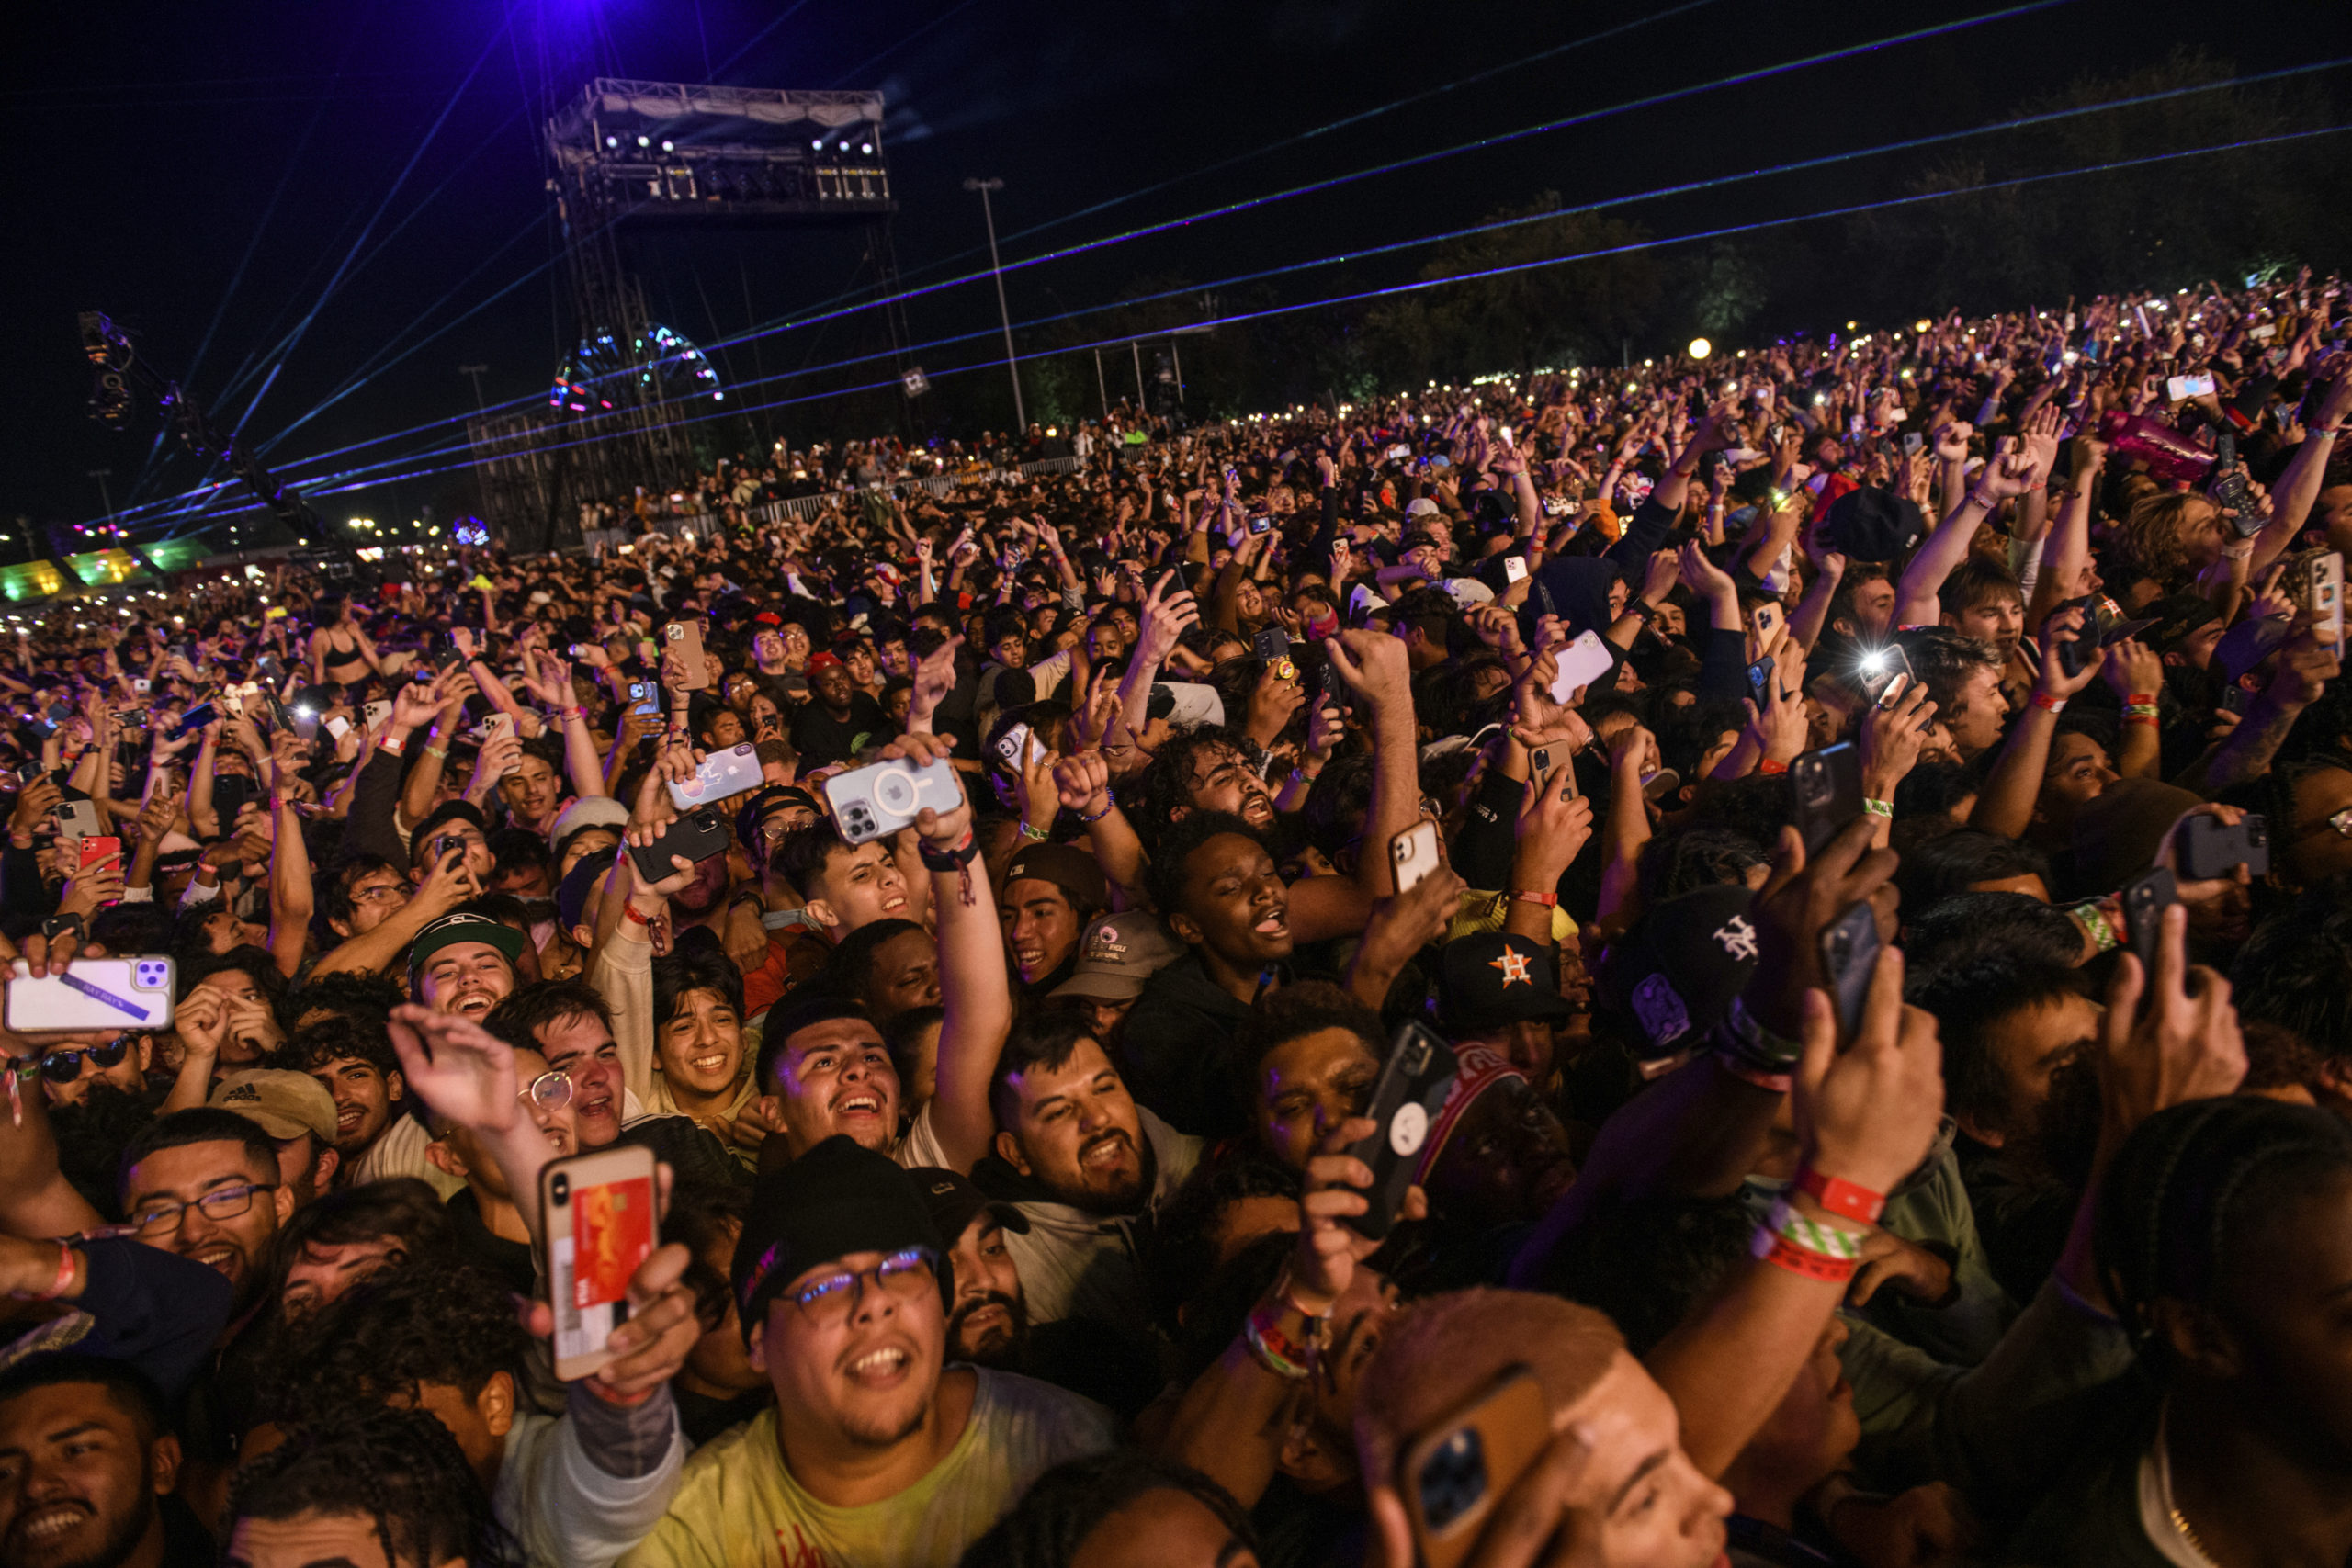
Jamaal Ellis/Houston Chronicle via AP
The Post’s story pinpointed ground conditions before any law enforcement agency publicly did, and it showed that there was no basis to initial public explanations that rampant drug use was likely a cause. Our team showed videos and maps of the stage to crowd control experts who faulted the layout of barriers, saying it did not allow concert organizers to cut off the flow of people surging toward the stage.
The investigation found that the concert continued for nearly an hour after three of the victims were unconscious in a pile of other fallen fans only 16 minutes into the show.
We faced the challenge of finding as many visuals as possible — visuals that told us more about what happened to the victims who died. The team worked together over 18 days to survey all social media platforms, review available Houston emergency communications, interview witnesses and relatives of and lawyers for the victims, and consult crowd control and density experts.
The combination of open-source and traditional reporting, as well as innovative techniques in syncing footage and crowd counting, revealed new information about the tragedy. We used these same techniques to examine the fatal crowd crushes in Indonesia and Korea that killed hundreds in October alone, work that would have been impossible without the existence of video from multiple angles. This type of storytelling is profoundly clarifying about what went wrong and holds officials to account. After publication, a mother whose daughter begged on-scene crews to halt the concert wrote to The Post: “My daughter and I watched it together and it really helped me more deeply understand what she went through that night.”
The New York Times
by Malachy Browne
The New York Times has deployed dozens of reporters, photographers, videographers, audio journalists, writers, and others to Ukraine and the countries bordering it to deliver in-depth reporting on the conflict and its repercussions across the region. Times journalists are bearing witness to events on the ground as they unfold, reporting from battlefields, hospitals, improvised bomb shelters, and contested cities to document the war firsthand.
But our reporters cannot be everywhere, and some of the richest sources of information emerging are people sharing videos, photos, and reports of what’s happening in their communities on social media. From the start of the conflict, the Visual Investigations team at The Times, which includes Ukrainian researchers, has monitored Twitter lists, local Facebook groups, and Telegram channels to listen to what those witnesses — and officials in Russia and Ukraine — were saying.
Here’s how open-source reporting has contributed to breaking news and investigations at The Times.
In March, our investigators discovered that some Russian forces inside Ukraine were communicating on open radio channels. By meticulously cross referencing the transmissions with information about Russian activity gleaned from social media, we were able to ascertain the time and place where some of the chatter was coming from — and determine the kinds of units operating in an area outside of Kyiv. That allowed us to eavesdrop on troops essentially admitting they were told to fire on civilians — a war crime.
What’s different in this war is the volume of digital evidence available through open sources and on-the-ground reporting — evidence that enables newsrooms to inform the world and achieve accountability
When Russian forces withdrew from the town of Bucha at the end of March, the world recoiled at what was left in their wake — dozens of bodies on Yablonska Street, in basements and gardens, many of them apparently executed. Russia’s president described the images as “another hoax,” claiming that Russian soldiers were not present when the bodies appeared. Our team rebutted those claims by showing through satellite images that the bodies had laid on the street for weeks, while Russia controlled the town.
Then began the process of finding out who these victims were, how they were killed, and who was responsible. The Visual Investigations team dispatched reporters Yousur Al-Hlou and Masha Froliak, who spent months in Bucha and Kyiv interviewing witnesses and survivors, and collecting previously unpublished videos from witnesses, drone and security camera footage, documents from the police, military commanders, and Ukrainian investigators.
One investigation showed how Russian paratroopers rounded up and executed at least eight Ukrainian men at one office building on Yablonska Street. By scouring Telegram channels and Facebook groups for missing persons reports, contacting relatives, and collecting autopsy reports and death certificates, our reporters — for the first time — identified all eight men.
The team also obtained more than 4,000 recordings of Russian soldiers’ phone calls intercepted in the Bucha area by Ukrainian law enforcement agencies. The soldiers gave damning and completely unfiltered insider accounts of battlefield failures and civilian executions. We independently authenticated the calls using various methods, including cross-referencing outgoing and incoming Russian phone numbers with cell phone messaging apps and Russian social media accounts.
Russian leaders may deny the atrocities committed in Ukraine and peddle propaganda at home. What’s different in this war is the volume of digital evidence available through open sources and on-the-ground reporting — evidence that enables newsrooms to inform the world and achieve accountability.


